

Know your numbers.
Explore 55+ connected reports across sales, cash, service, delivery, inventory and workforce operations, built from the activity your team records.
See the business at a glance.
Unified metrics across all outlets, refreshed as orders come in.
Last 24 Hours
Net sales
$45,200
Up 12% versus the previous 24 hours
Order count
1,240
Up 4% versus the previous 24 hours
Avg order value
$36.45
Up 8% versus the previous 24 hours
Top category
Premium Burgers
Cash variance
$0.00
Drawers balanced, no variance
Kitchen prep time
7.5 min
Down 0.5 minutes versus the previous 24 hours
Delivery completion
98%
Up 2% versus the previous 24 hours
Labor cost
18%
Target met
Sample figures shown for illustration. Which metrics appear, and the targets they are measured against, are configured per outlet. Changes compare the last 24 hours with the 24 hours before.
Find the right report without searching through every module.
Operational deep-dives
Revenue intelligence
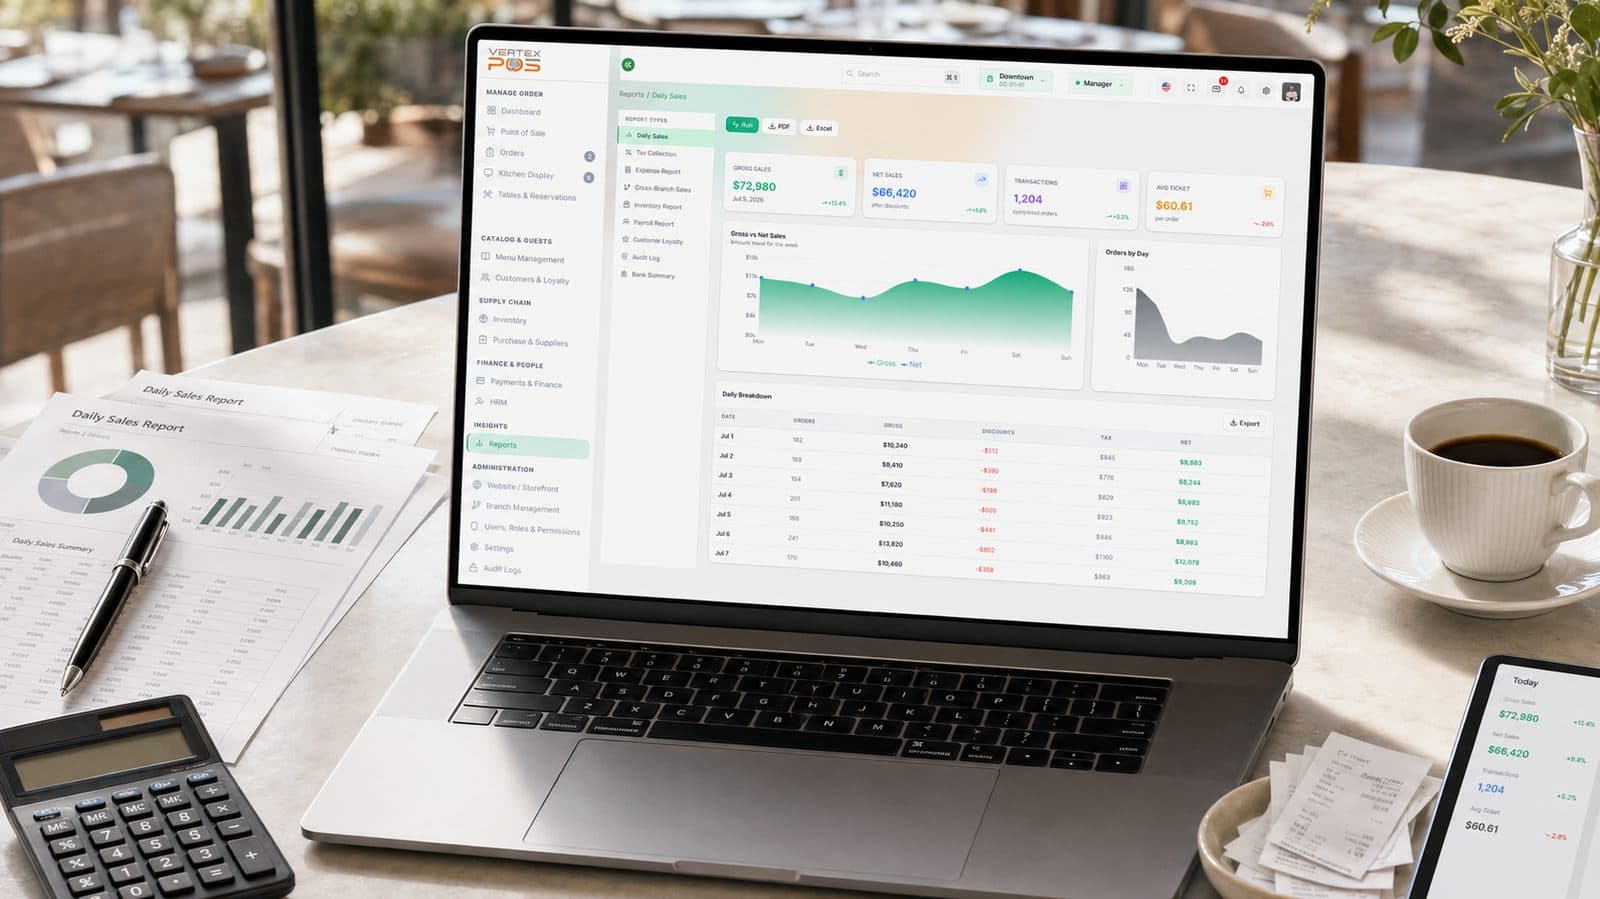
Sales Analytics
Granular tracking from the whole menu down to a single garnish. Identify high-margin favorites and underperformers quickly.
- Sales by Item & Category performance
- Kitchen efficiency correlation with volume
- Waiter productivity & upselling tracking
Service excellence
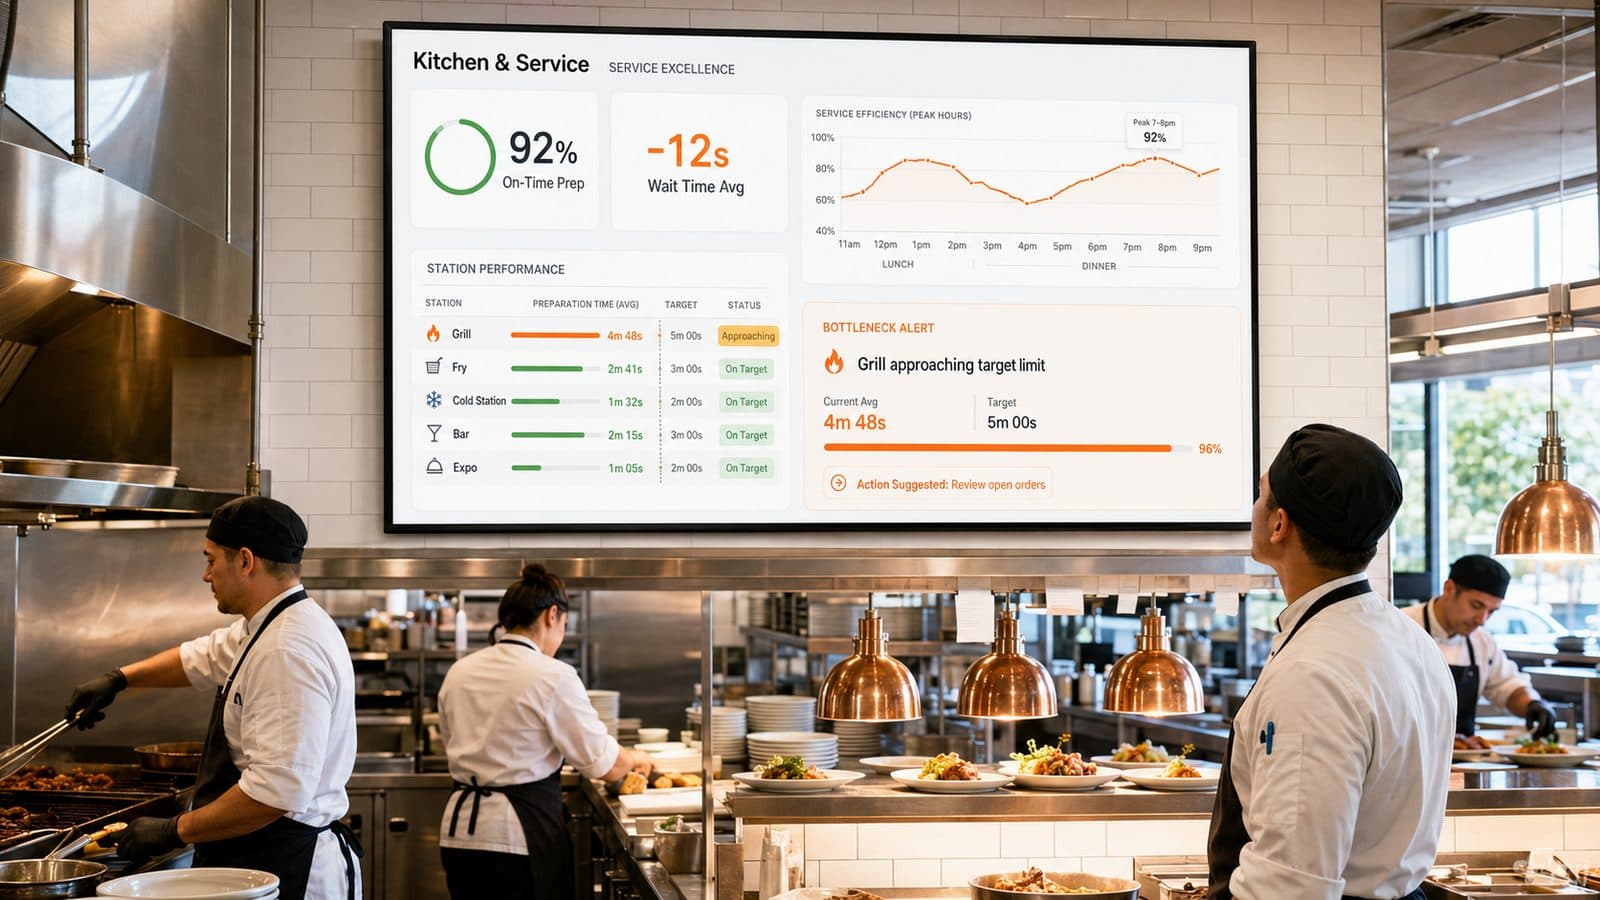
Kitchen & Service
Eliminate bottlenecks before they start. Measure preparation times by station and track staff efficiency during peak hours.
- On-Time Prep
- 92%On-Time Prep
- Wait Time Avg
- -12sWait Time Avg
Sample figures shown for illustration.
Move from summary to source.
Deep dive into any metric. Open a sales total to see the individual transactions, staff members, and modifications that made it happen.
Export formats
- CSV
- XLS
| Order ID | Outlet | Waiter | Status | Total |
|---|---|---|---|---|
| #7829-X | Midtown Kitchen | Sarah J. | Completed | $124.50 |
| #7830-X | Downtown Express | Michael R. | Preparing | $42.00 |
| #7831-X | Midtown Kitchen | Sarah J. | Completed | $89.20 |
Sample figures shown for illustration.
Frequently Asked Questions
The hero on this page states 55+ connected reports, grouped into seven categories you can browse rather than hunt for module by module — Executive, Sales, Payments, Kitchen, Delivery, Inventory and HR. Above that sits an executive dashboard that pulls a single set of headline figures across all outlets: net sales, order count, average order value, top category, cash variance, kitchen prep time, delivery completion and labour cost, with a period selector such as Last 24 Hours. Underneath are the deep dives — Sales Analytics covering sales by item and category, kitchen efficiency against volume, and waiter productivity and upselling; and Kitchen & Service covering preparation times by station and staff efficiency during peak hours, with a bottleneck alert when a station drifts toward its target limit. From a summary figure you can drill through to the individual orders behind it, and any view can be exported as PDF, CSV or XLS. Two things worth saying at the start. Every number on this page — the $45,200, the 92% on-time prep, the outlet and waiter names — is sample data used to show the shape of the screens, not a projection of your results. And a report describes what was recorded; the answers below are fairly specific about what that does and does not let you conclude.
It means the dashboard reads from your live transaction data rather than from a nightly batch, so a figure moves shortly after the order behind it is committed at the till — you are not waiting for an overnight rebuild to see today's sales. That is the whole of the claim, and it is worth being plain about the edges. A metric can only move once something is recorded: an order still open on a terminal, a cash sale rung up late, a terminal that dropped offline and is holding transactions until it reconnects, a delivery not yet marked complete — none of those exist on the dashboard until they land. Sub-minute freshness also does not make a short window meaningful. A 24-hour panel read at 11am is a partial day and will look nothing like the same panel at close, and a variance that looks alarming mid-service often resolves itself by end of shift. Fresh data is useful for spotting a problem while you can still do something about it; it is a poor basis for judging a trend. For trends, use a period long enough to absorb a quiet Tuesday.
The arithmetic is reliable; whether the figures describe your business is a separate question, and it depends on what your team recorded. Vertex reports what reached the system. Sales rung up under the wrong item or the wrong category, comps and voids applied loosely or after the fact, waste and staff meals thrown away without being logged, stock received or wasted without being counted, a modification keyed as a note instead of a priced option, an order taken on paper during a rush — each of those flows straight through into a total and looks exactly as authoritative as a figure that was captured correctly. So read a report as a prompt to go and look, not as a verdict. A food cost that jumps could be a supplier price rise, a portioning drift, a mis-coded delivery, unlogged waste or a menu item mapped to the wrong category, and the report will not separate those for you. Cash variance sitting at zero is worth as much attention as a variance that does not: it can mean the drawer balanced, or it can mean nobody counted it. Where the figures matter, the useful habit is to check them against something recorded independently — a supplier invoice, a bank statement, a physical count — and to fix the recording at the source rather than adjusting the report. Better inputs are what make the outputs worth reading.
Click a sales total and you move from the summary to the transactions underneath it: the individual orders with their order ID, outlet, waiter, status and total, along with the staff members involved and the modifications applied. That is what the section calls moving from summary to source, and it is the part of the page that does most of the work — a figure you cannot open is a figure you have to take on faith, while a figure you can open is one you can argue with. A note on the staff-level views, since Sales Analytics does track waiter productivity and upselling and Kitchen & Service does track efficiency by station during peak hours. These reports record throughput and attribution, not performance. A waiter on the quiet section, a station short-handed on a Saturday, a shift covering a delivery surge or an order transferred between staff will all move the numbers for reasons that have little to do with how well anyone worked. Treat these views as a starting point for a conversation with the person, and please check your local employment rules on monitoring and on using this kind of data in performance decisions — that sits with you as the employer, not with the software.
Through export. Any report or drilled-down view can be exported as PDF, CSV or XLS — PDF when you want a fixed document to circulate or file, CSV or XLS when someone wants to pivot the rows in a spreadsheet or hand them to a bookkeeper. Those three formats are what this page shows, and we would rather set that out plainly than gesture at something broader. This page does not claim a connector to any external analytics or business-intelligence platform, a warehouse sync, or an API feed, so please do not plan an integration around one on the strength of this page. If your setup depends on data reaching a specific system, ask our sales team what is available for your plan and region and get the answer confirmed before you commit to it. One practical caution about exports: a CSV taken at 3pm is a snapshot of that moment, and late-recorded transactions, refunds and end-of-day corrections can change the same report afterwards. If a figure is going to be quoted or reconciled, export it after the period is closed and label the file with the period and the time it was taken, so two people comparing spreadsheets can tell whether they are looking at the same thing.
You can export them and give them to your accountant, and sales, payments and labour reports are a reasonable starting point for that conversation. What they are not is a filing, and Vertex does not make you compliant. Vertex reports according to the configuration you set up — the tax rates and codes your business uses, how they map to your revenue and expense categories, which categories are treated as exempt, and whether your prices are handled tax-inclusive or tax-exclusive. It applies that configuration consistently; it does not decide what the configuration should be. You will not find a rate, a threshold, a filing deadline, a retention period or a required invoice format stated on this page, because those are jurisdiction-dependent, they change, and they are configuration rather than product defaults. Nor does Vertex monitor rate changes for you: if a rate you use moves, you update it. And the data-quality point above applies with more force here than anywhere else, because a sales figure that is merely indicative for a menu review is not good enough for a return — unrecorded cash, comps applied inconsistently or a category mapped to the wrong tax code will produce a report that looks orderly and still misstates what you owe. Determining the correct treatment, keeping the configuration current and filing what is due remains yours to settle with your accountant or tax adviser.

Ready to see your numbers in one place?
See how Vertex pulls sales, payments, kitchen, inventory and workforce activity into one reporting view your team can filter by branch, compare across periods and export — built from the activity your own staff records.